By Ben Casselman

There were 46.2 million people living in poverty in America last year. Unless there were 49.7 million.
Earlier this fall, the Census Bureau released its annual look at poverty in the U.S. According to that report, there were 46.2 million people in 2011 living below the poverty line of about $23,000 for a family of four. The official poverty rate was 15.0%.
But on Wednesday, the Census put out another report showing that the official figures leave out some 3.5 million people whom many experts argue should properly be counted as “poor.” If those people were included, the poverty rate would be 16.1%.
The difference comes down to definitions. The government’s official definition of poverty dates back to the 1960s, when economist Mollie Orshansky drew the poverty line at three times the cost of a minimal diet. That figure, updated for inflation, has remained more or less unchanged ever since.
Economists have argued for years that the official definition of poverty manages to be both too broad and too narrow. Because it looks only at pretax income, the official rate ignores all sorts of government programs — including food stamps, Social Security, subsidized housing and various tax credits — that help keep families out of poverty. But it also fails to account for taxes, transportation costs, child and health-care bills and other expenses that eat into disposable income. And because the poverty line is the same across the country, it fails to account for huge regional differences in the cost of living, especially when it comes to housing.
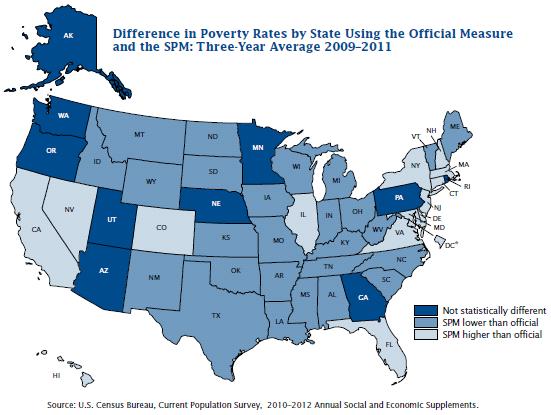
The alternative, or “supplemental,” poverty measure released Wednesday attempts to account for those criticisms. The supplemental measure, which the Census Bureau released for the first time last year, doesn’t look that different from the official rate on a national level, and neither definition shows much change in 2011 from 2010. But for certain groups, the different definitions make a much bigger difference.
Under the official definition, for example, there are 16.5 million children under 18 living in poverty, for a poverty rate of 22.3%. But because many government antipoverty programs target children, the alternative definition yields a lower rate of 18.1%, a difference of more than 3 million people.
Among seniors, however, the updated definition has the opposite effect, yielding a poverty rate of 15.1%, far higher than the official rate of 8.7%. What accounts for the difference? Out-of-pocket medical expenses, which aren’t accounted for in the official rate but push nearly 3 million seniors into poverty.
Wednesday’s report for the first time provides a state-by-state look at the new poverty measure. There too the effect of the new approach varies. Mississippi’s worst-in-the-nation 21.1% poverty rate would be just 15.8% — still high, but better than several other states including New York and Texas. (The state-level data are based on three-year averages.) Nevada’s poverty rate, however, would rise to 19.4% from an official rate of 15.1%.
Poverty numbers can be a politically fraught topic, with conservatives arguing that most definitions are overbroad, including people who aren’t poor once government benefits are taken into account, and liberals arguing they are too narrow, underestimate living expenses, especially for families with children.
But Columbia University Professor Jane Waldfogel says the strength of the new Census approach is its transparency. The report lays out how various programs and assumptions effect its calculations — and what the poverty rate would look like if they were left out.
“You can see exactly what the effect of the different antipoverty programs is,” Ms. Waldfogel says. “We just need to be clear what we’re measuring when we’re measuring poverty.”
